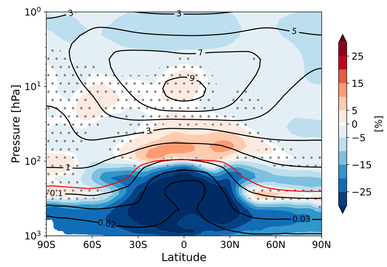
Figure. ozone percentage change (color scale) for LGM_PMIP3 versus PI. Black contours show the ozone concentration (ppmv) in PI, and red line represents the tropopause in PI.
|
Stratospheric ozone in the Last Glacial Maximum
Key points:
|
Wang, M., Fu, Q., Solomon, S., White, R. H., & Alexander, B. (2020). Stratospheric Ozone in the Last Glacial Maximum. Journal of Geophysical Research: Atmospheres, e2020JD032929.